

Lorem ipsum dolor sit amet, consectetur adipiscing elit, sed do eiusmod tempor incididunt ut labore et dolore magna aliqua. Quis viverra nibh cras...
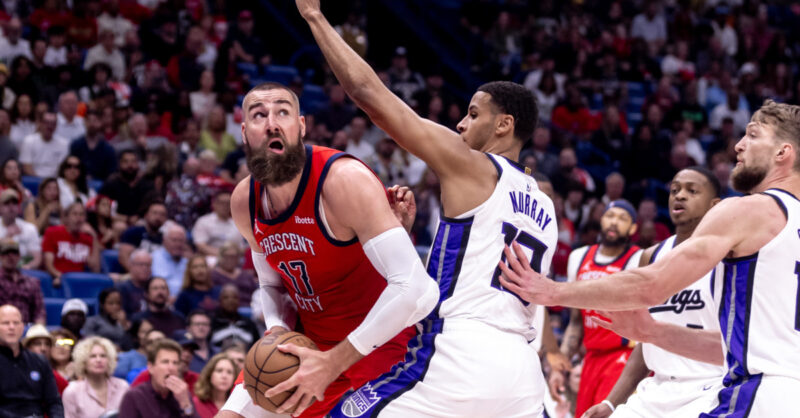
Pelicans 105, Kings 98: New Orleans overpowers Sacramento in the same old ways
The Kings never gave up, but never really had control.