


Lorem ipsum dolor sit amet, consectetur adipiscing elit, sed do eiusmod tempor incididunt ut labore et dolore magna aliqua. Quis viverra nibh cras...
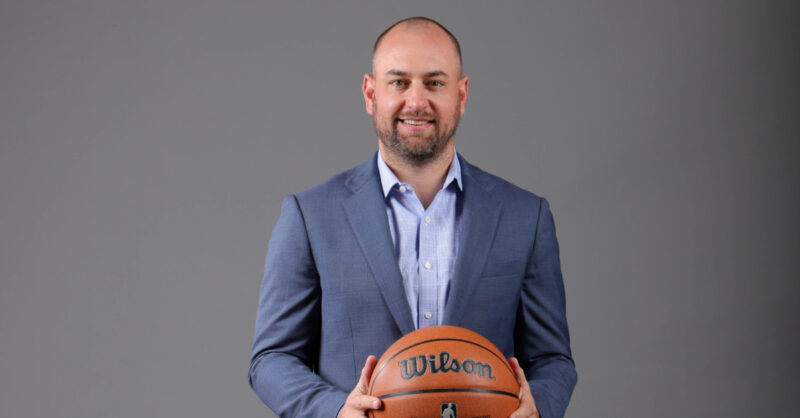
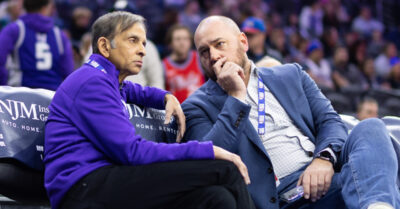
McNair on Monk’s free agency: ‘He loves it here, we love him … we’ll put our best foot forward’
Monte McNair made it clear the Sacramento Kings want to bring Malik Monk back this offseason.