Lorem ipsum dolor sit amet, consectetur adipiscing elit, sed do eiusmod tempor incididunt ut labore et dolore magna aliqua. Quis viverra nibh cras...


Lorem ipsum dolor sit amet, consectetur adipiscing elit, sed do eiusmod tempor incididunt ut labore et dolore magna aliqua. Quis viverra nibh cras...
Lorem ipsum dolor sit amet, consectetur adipiscing elit, sed do eiusmod tempor incididunt ut labore et dolore magna aliqua. Quis viverra nibh cras...
Lorem ipsum dolor sit amet, consectetur adipiscing elit, sed do eiusmod tempor incididunt ut labore et dolore magna aliqua. Quis viverra nibh cras...

A rematch, sort of, is going down tonight at Golden 1 Center. Both coaches talk about it.
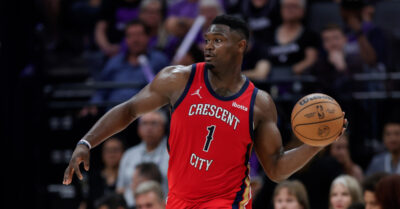
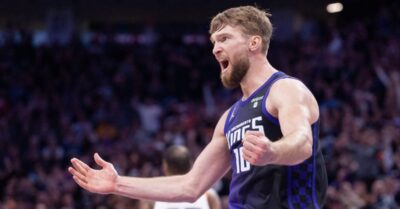
In order to keep their playoff hopes alive, the Kings will have to vanquish a familiar old foe.

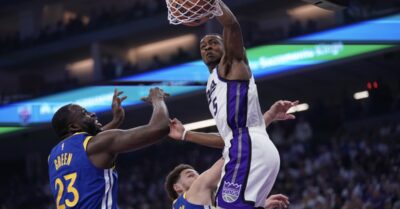
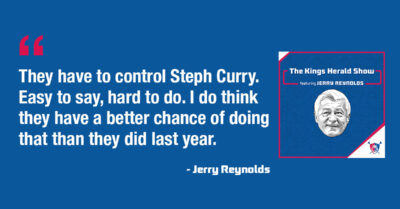
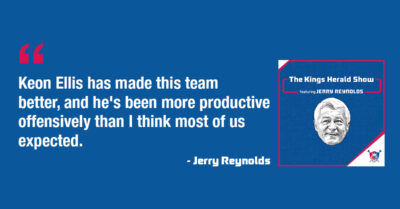
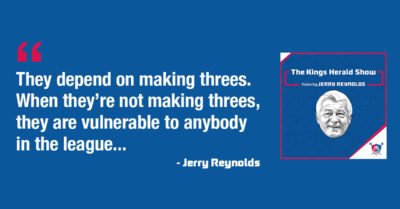
The Kings Herald Show returns to discuss *another* big game against the Warriors.
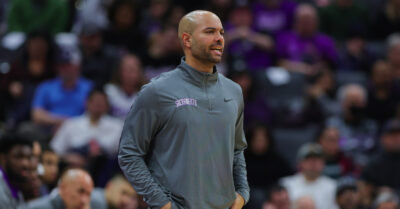
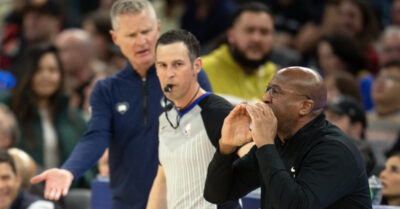
Mike Brown is losing his top assistant.

The Kings will be in a do-or-die situation with draft pick ramifications.
Sacramento needed to take care of business in game 82. They did exactly that.
Go Kings!
The 2023-24 regular season comes to a close with the Kings needing one more win to increase their chances at a playoff spot.
Sacramento had everything in front of them. They finished behind once again.
Go Kings!
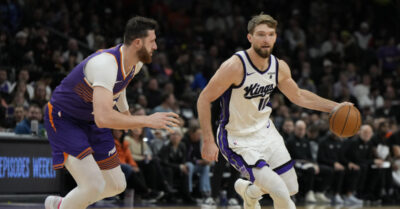
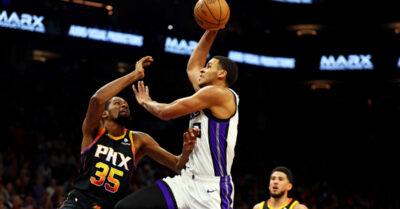
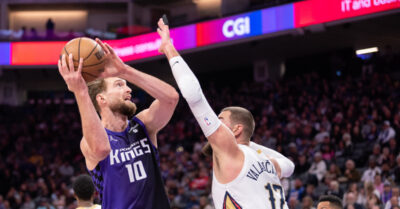
The Kings playoff hopes likely hinge on tonight's matchup against the Phoenix Suns.
The Kings went down big, came back, went down big again, and then tried to come back again.
Go Kings!

At this point in the season, every game is a must win.
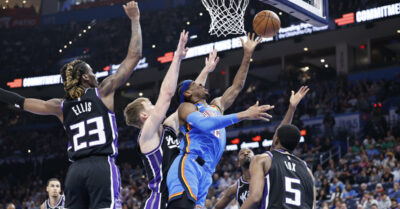
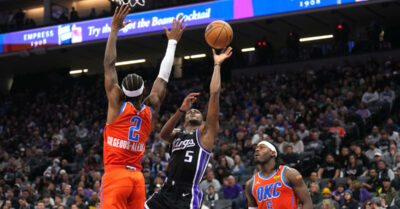
The Thunder topped the Kings despite by games from Fox and Ellis.
Go Kings!
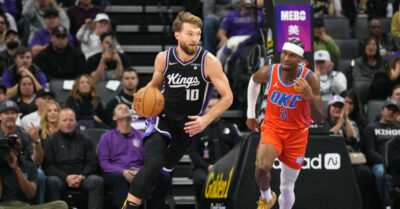
The Kings head to Oklahoma City for their final road game of the 2023-24 season.
The latest news and notes for the Kings.
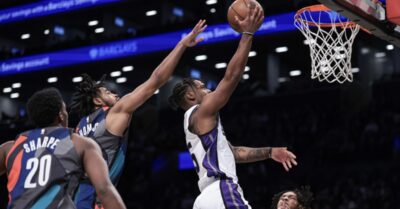
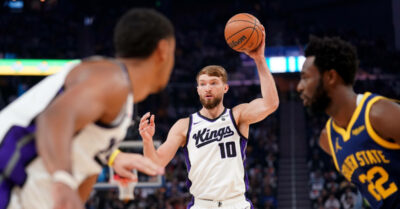
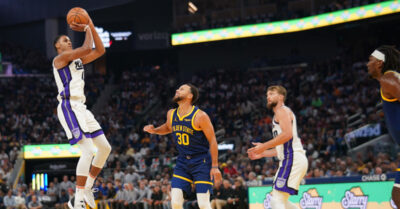
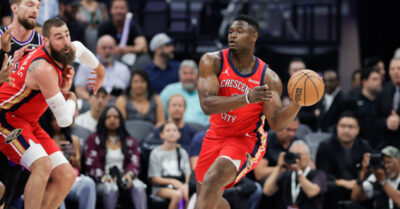
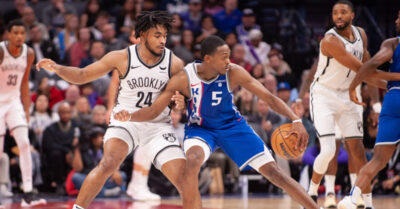
The Kings held the Nets to their lowest point total of the season and kept pace amongst the logjam in the Western Conference's play-in race.
Go Kings!